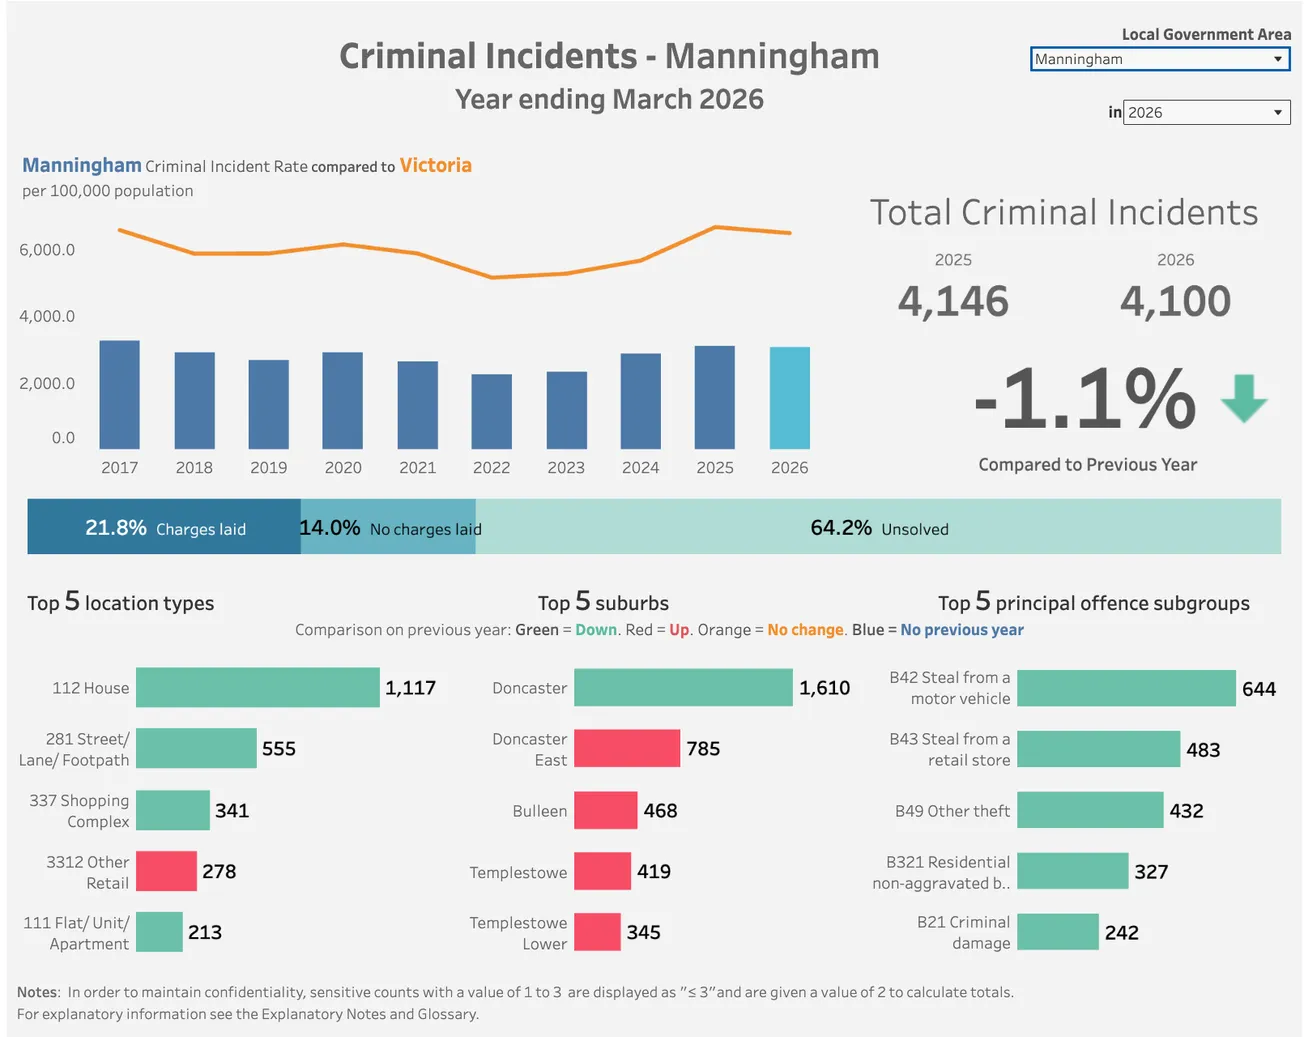
The latest Crime Statistics Agency figures for the year ending March 2026 show 4,100 criminal incidents were recorded in Manningham, a 1.1% decrease from 4,146 incidents in the previous year.
Manningham vs Victoria: Manningham continues to record a significantly lower criminal incident rate per 100,000 population than the Victorian average.
Of all criminal incidents recorded in 2026:
- 21.8% resulted in charges being laid.
- 14.0% had no charges laid.
- 64.2% remain unsolved.
The most common locations for crime were:
- Houses (1,117 incidents)
- Streets, lanes and footpaths (555)
- Shopping complexes (341)
- Other retail locations (278)
- Flats, units and apartments (213)
The suburbs recording the highest number of criminal incidents were:
- Doncaster – 1,610
- Doncaster East – 785
- Bulleen – 468
- Templestowe – 419
- Lower Templestowe – 345
The five most common offence categories were:
- Theft from a motor vehicle (644)
- Theft from a retail store (shop theft) (483)
- Other theft (432)
- Residential non-aggravated burglary (327)
- Criminal damage (242)
Overall, the figures indicate that crime levels in Manningham have remained relatively stable over the past year. Property-related offences continue to account for the majority of recorded incidents, while Manningham's criminal incident rate remains significantly lower than the Victorian average.